
Indicators and Courses
What is Volume Price Analysis?
Volume price analysis is the correlation between price and volume of an asset. Finding “disagreements” or anomalies between price and volume can lead to different trading opportunities. These anomalies can assist in determining the future price.
Why are these indicators valuable?
These indicators can assist in discovering “disagreements” or anomalies between price and volume. Each trader has the ability to adjust the settings of these indicators to meet your trading style.
Do I need additional indicators?
It is recommended to add the Volume indicator within TradingView. This is a free indicator.
How do I add the indicator to my TradingView account (after purchase)?
Keep in mind you must have a TradingView account. They are completely free, and do not require the premium version to use these indicators.
After Purchase: It can take up to 24 hours for the indicator to be activated in your account, but typically takes less than 12 hours.
Step 1: Log into your TradingView account.
Step 2: Open the chart to whatever ticker you are trading. (Or any ticker for that matter)
Step 3: Click on “Indicators” (Desktop will be at the top) Mobile will be at the bottom, you will need to click the “+” then “indicators”.
Step 4: When activated, you will see an “invite-only scripts” option. Open that, and you will see your Volume Price Analysis indicator you purchased.
Step 5: Adjust indicator settings to your trading style.
Types of Anomalies
-Low Range/High Volume Anomaly - Included in All Anomalies and Group 1
This anomaly signals when the open and close price is in a small range while volume is high, based on your settings. In settings, you are able to adjust the volume moving average (helps determine your high volume), the delta of close and opening prices, the volume added to the average volume (helps determine high volume), and the label color.


-High Range/Low Volume Anomaly - Included in All Anomalies and Group 1
Very similar to the anomaly above, this anomaly signals when the open and close price is in a high range while volume is low, based on your settings. In settings, you are able to adjust the volume moving average (helps determine your low volume), the delta of close and opening prices, the volume subtracted from the average volume (helps determine low volume), and the label color.
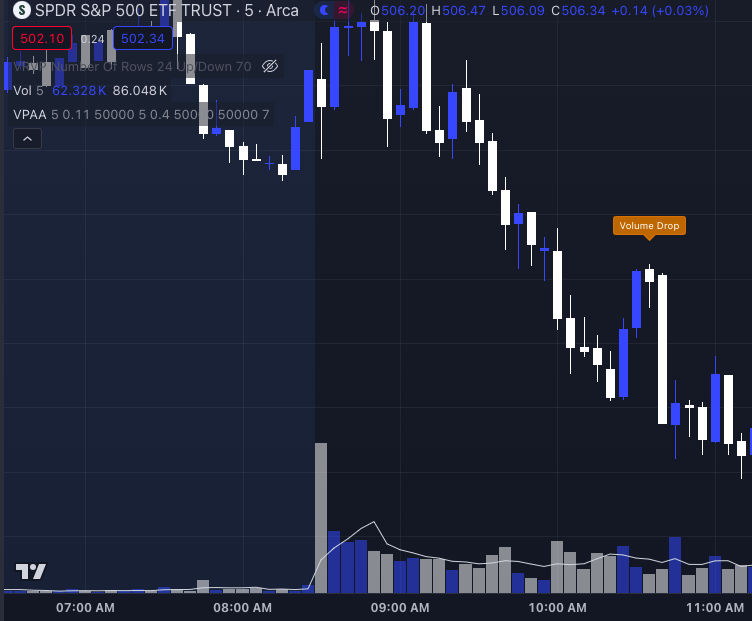
-Volume Drop Anomaly - Included in All Anomalies and Group 2
The volume drop anomaly determines when price continues to move in the same direction but there is a significant drop in volume between the two candlesticks. In settings, you can adjust what the volume difference is between the two candles. The label color can also be adjusted.
-Long Wicks - Included in All Anomalies and Group 1
Long wicks can help determine when price action is showing a long wick in either direction based on your settings. In settings, you are able to adjust a multiplier of the open/close range to the length of the wick as well as the label color.


-Three Candle Pullback Anomaly - Included in All Anomalies and Group 2
The three candle pullback anomaly label appears on your chart when volume drops for three consecutive candles will price continues to move in the same direction. If price continues to rise for three candles while volume decreases each candle, that will trigger the label. In settings you can adjust the label color.
All anomaly types have the ability to be removed from your chart by going to settings, and unchecking the box for that specific anomaly. This gives you flexibility to focus on the anomalies that work best for your and your trading style.